
Richard So
March 1, 2026
How do you stay on track with your retirement goals?
How does our wealth planning tool support your financial decisions?
- Visualize how your net worth and cash-flow may evolve over time by accounting for all financial resources and obligations throughout your life expectancy
- Stress test how much risk you can take and the return required to meet your personal financial goals
- By understanding your financial position, our team will be able to provide wealth planning insights and recommendations tailored to your financial goals
Below is a case study of a household.
PART 0. Case Study Background Assumptions
Client A & Client B's Household (assume inflation rate = 2.25%)
Client A | Client B | ||
Current Age | 58 | Current Age | 60 |
Retirement Age | 65 | Retirement Age | 65 |
Life Expectancy | 95 | Life Expectancy | 95 |
Investment Rate of Return | 5.58% | Investment Rate of Return | 5.58% |
Eligible Government Benefits | CPP & OAS (max) | Eligible Government Benefits | CPP & OAS (max) |
Employment Income | $200,000 / year | Employment Income | $150,000 / year |
RRSP | $400,000 | RRSP | $700,000 |
TFSA | $150,000 | TFSA | $150,000 |
Joint Assets & Liabilities
Non-Registered Account | $750,000 |
Property | $2,000,000 |
Investment Property | $1,000,000 |
Mortgage | $300,000, interest rate 4% |
Rental Income | $3,500 / month |
Expenses | $100,000 / year |
PART 1. Net Worth Projection
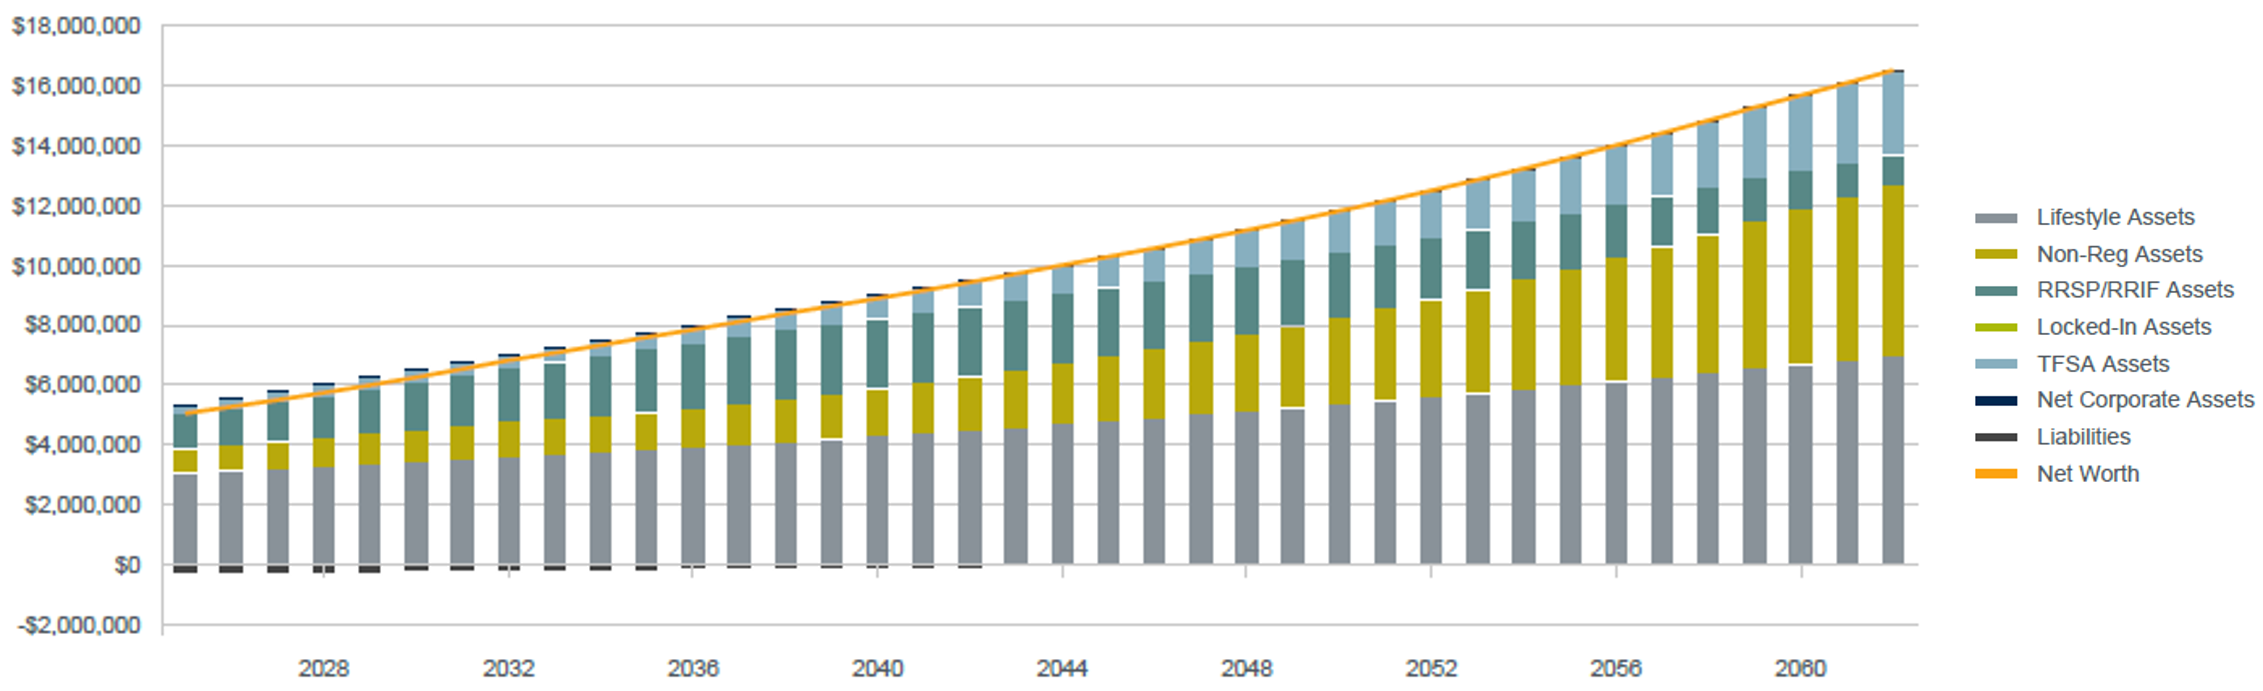
This chart shows the projected net worth of the household at life expectancy, incorporating all assets and liabilities.
PART 2. Cash Flow Projection
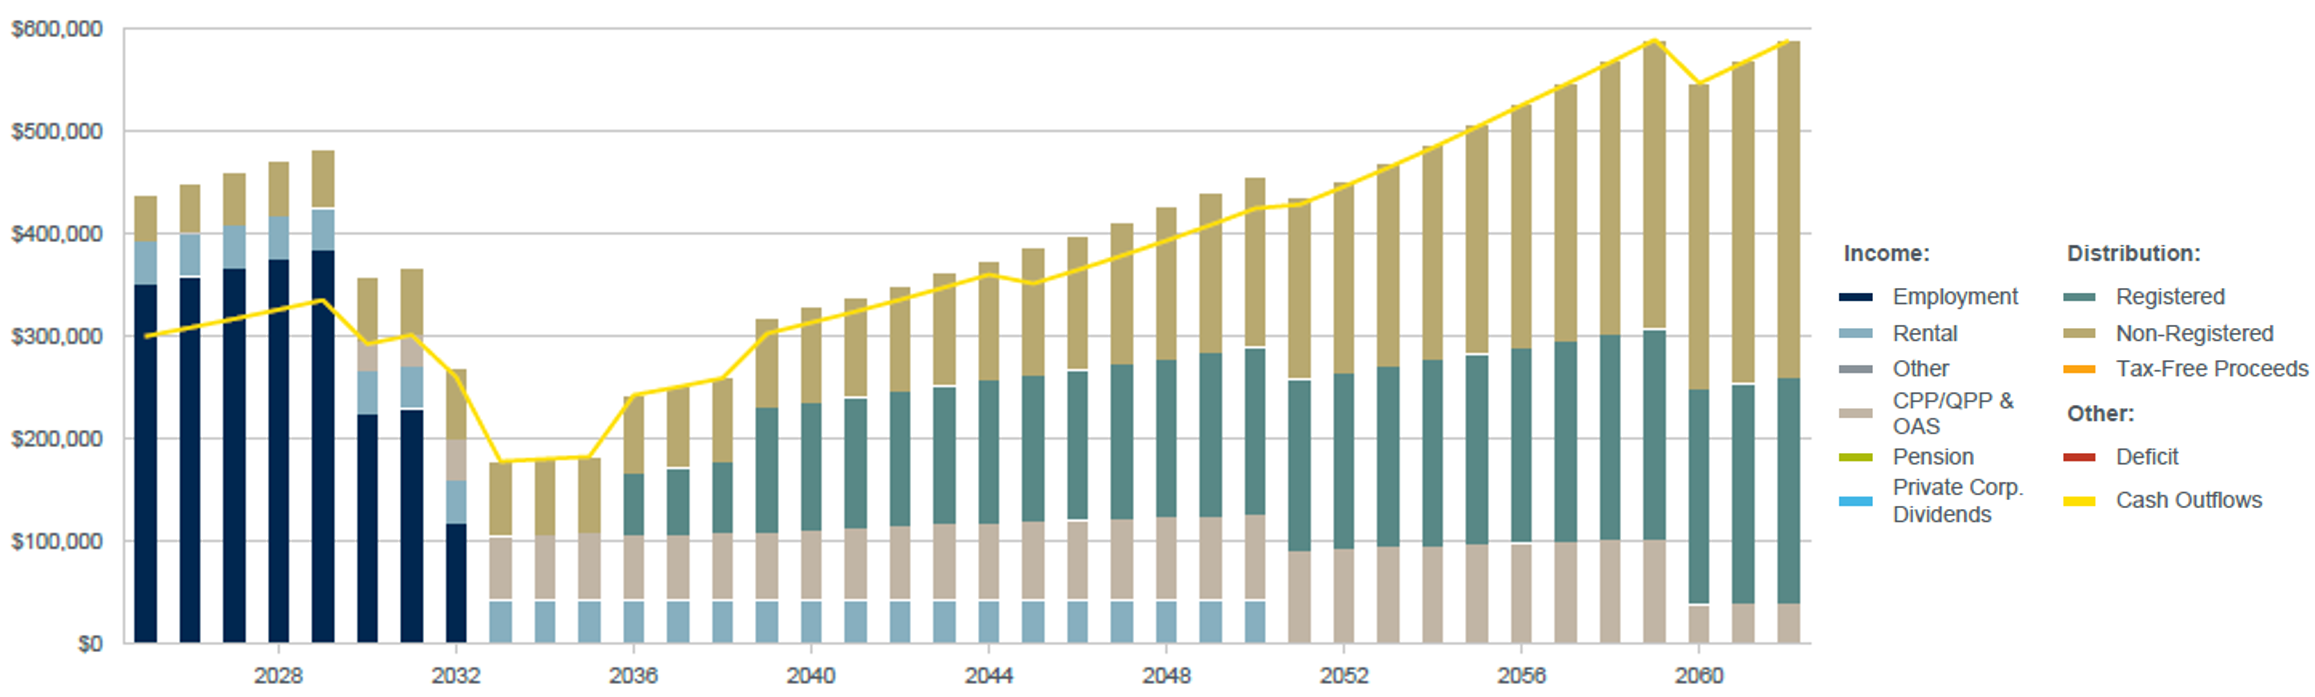
The chart above illustrates the clients' cash inflows and outflows, factoring in all income and distributions.
PART 3. Total Estate Impact Analysis
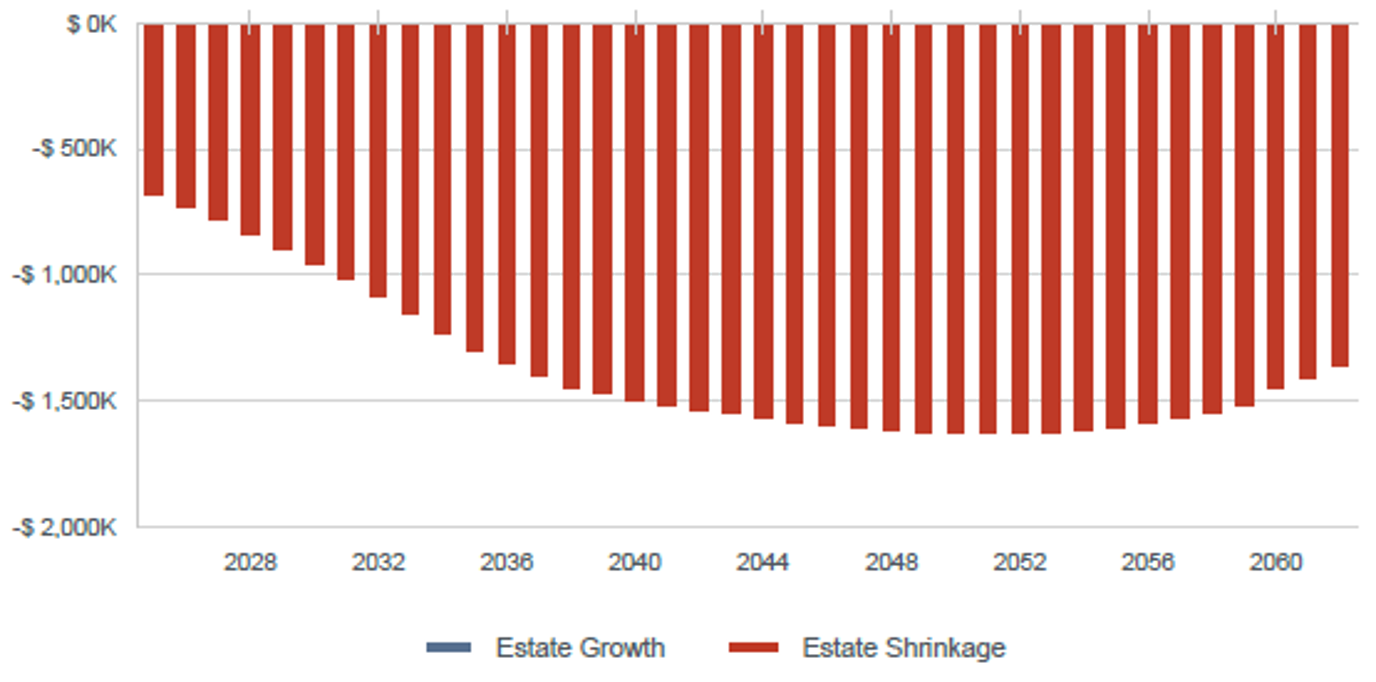
This chart projects potential estate shrinkage if both clients passed away in any given year, due to an estimated amount of taxes payable.
PART 4. Stress Testing Analysis
Stress testing your net worth helps you understand your risk capacity and how certain lifestyle choices may impact your future estate.
4.1. Stress Testing Analysis (things you can control)
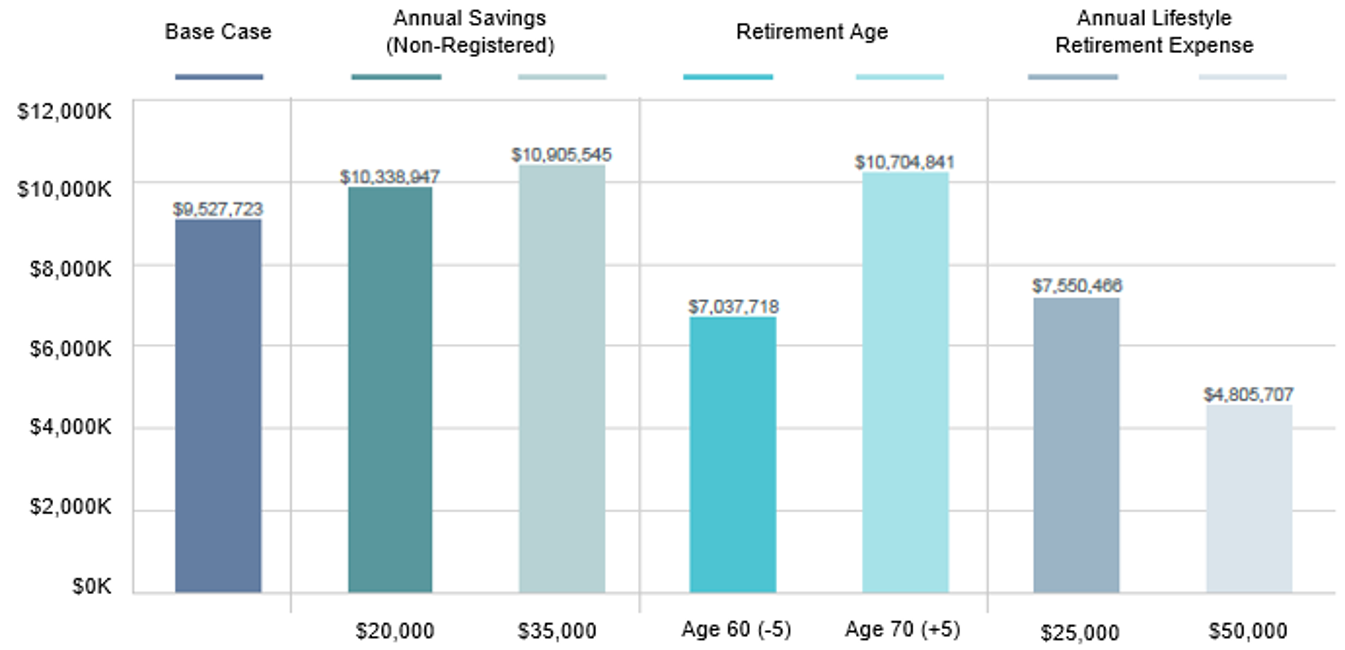
This is a sensitivity analysis showing how various controlled scenarios may affect total investable assets at death.
4.2. Stress Testing Analysis (things hard to control & cannot control)
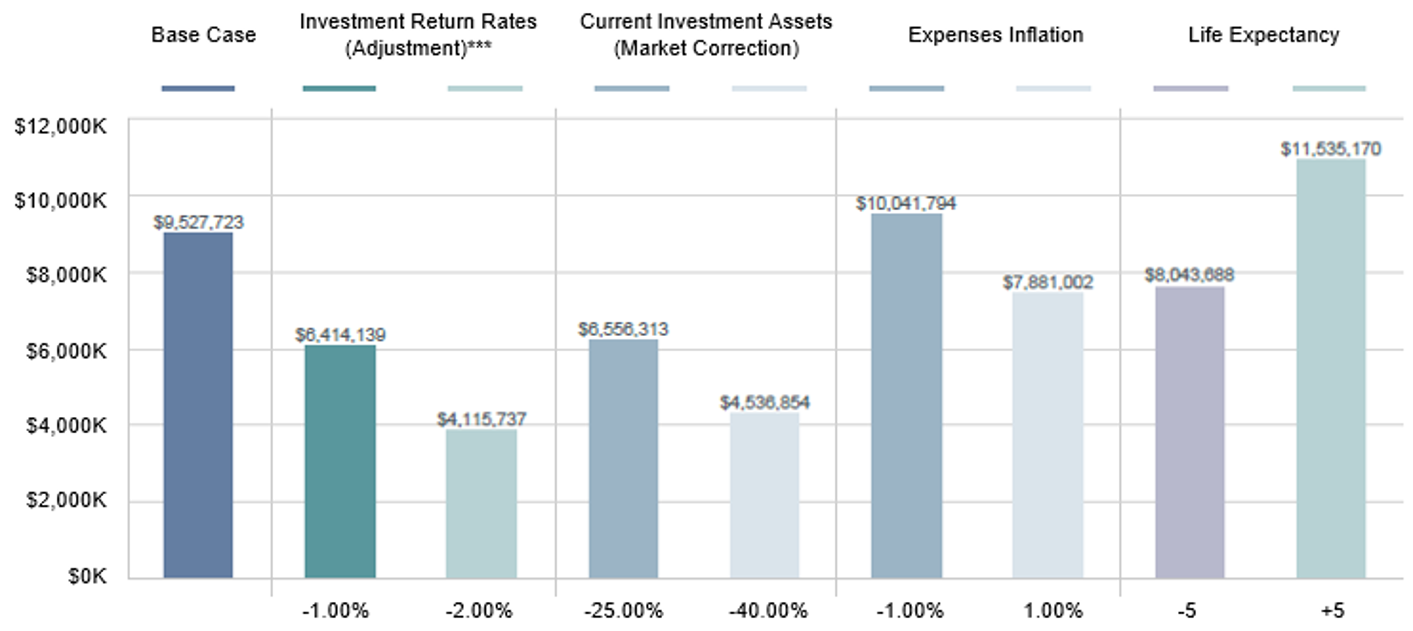
This sensitivity analysis highlights how different market factors outside of the clients' control can impact the household’s investable assets at death.
Our wealth planning tool can stress test both single and multiple variables, making planning more realistic and helping you prepare for retirement.